

Understanding OEM Supplier Scorecards and Performance: 2026 Framework
Understanding OEM Supplier Scorecards and Performance: A 2026 Framework
OEM supplier scorecards help brands evaluate contract manufacturers consistently, identify performance issues early, and make better sourcing decisions. Rather than treating the scorecard as a quarterly administrative exercise, effective procurement teams use it as an operating framework for supplier reviews, corrective actions, development plans, and future order allocation.
This guide explains the six main supplier performance categories, how to select and weight KPIs, how to calculate a composite score, and how to turn scorecard data into measurable action.
What Is an OEM Supplier Scorecard?

An OEM supplier scorecard is a structured tool used by a brand or original equipment manufacturer to measure the performance of a contract manufacturer producing finished goods, components, or sub-assemblies.
A typical scorecard combines quantitative KPIs, such as defect rates and on-time delivery, with qualitative assessments covering responsiveness, collaboration, risk management, and improvement efforts.
It can help a company:
- Track supplier performance over time
- Compare suppliers using consistent criteria
- Identify recurring quality or delivery problems
- Create corrective action plans
- Support supplier consolidation or replacement decisions
- Strengthen supplier relationships through structured feedback
The scorecard should not simply record past performance. It should give both the buyer and supplier clear evidence of what is working, what must improve, and what actions should follow.
Why Do OEM Supplier Scorecards Matter in 2026?
Supplier scorecards have become increasingly important because manufacturers are managing more complex supply networks, stricter customer requirements, and greater exposure to operational disruption.
Supply chain risks require earlier visibility
Late deliveries, quality escapes, material shortages, and sub-supplier failures can quickly affect inventory availability and customer commitments. A regularly updated scorecard helps reveal negative trends before they become major operational problems.
Sustainability and compliance data are becoming more important
Companies may need greater visibility into environmental, social, regulatory, and value-chain risks. European sustainability reporting requirements, for example, can require certain companies to assess impacts and risks arising within their value chains. However, the requirements vary by company size, jurisdiction, reporting scope, and implementation date.
Supplier consolidation increases dependence on retained partners
When a brand reduces its supplier base, each remaining contract manufacturer becomes more strategically important. A scorecard provides evidence for deciding which suppliers should receive additional volume, development support, or closer monitoring.
Which KPI Categories Should an OEM Supplier Scorecard Include?
Most supplier scorecards evaluate performance across six broad categories:
- Quality
- Delivery
- Cost
- Responsiveness
- Risk and compliance
- Innovation and continuous improvement
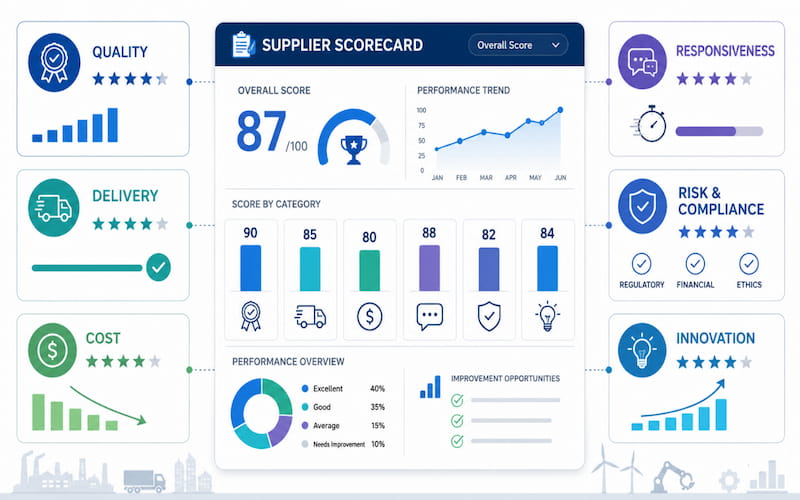
The exact metrics should reflect the product, industry, customer requirements, and risks involved. A focused scorecard is usually more useful than one containing dozens of loosely connected measurements.
Quality performance should measure product conformity
Quality is normally one of the highest-weighted categories because defects can lead to rework, returns, production stoppages, warranty claims, and reputational damage.
| KPI | Formula | Example Target |
| Defect Rate (PPM) | Defective units ÷ total units received × 1,000,000 | Set by product and industry risk |
| First-Pass Yield | Units passing without rework ÷ total units × 100 | Above 98% for many established production processes |
| Customer Return Rate | Returned units ÷ units sold × 100 | Trending downward |
| Incoming Rejection Rate | Rejected units ÷ units received × 100 | Within the agreed quality limit |
| Quality Audit Score | Completed audit score | Above the approved supplier threshold |
These figures should be treated as examples rather than universal benchmarks. Acceptable performance varies considerably between consumer products, industrial components, automotive parts, and regulated medical products.
Delivery performance should measure reliability
On-time, in-full delivery affects inventory levels, production planning, customer orders, and working capital.
| KPI | Formula | Example Target |
| On-Time Delivery | Orders delivered by the confirmed date ÷ total orders × 100 | Above 95% |
| Lead-Time Accuracy | Actual lead time compared with confirmed lead time | Within the agreed tolerance |
| Order Fill Rate | Quantity shipped ÷ quantity ordered × 100 | Above 98% |
| Delivery Completeness | Complete orders ÷ total orders × 100 | Above 97% |
| ASN Accuracy | Accurate and timely advance shipping notices ÷ total shipments × 100 | Above 95% |
The scorecard should clearly define whether delivery is measured against the original requested date, the supplier-confirmed date, or a revised date approved by both parties. Without this definition, delivery data can become misleading.
Cost performance should consider total cost
Unit price is important, but it should not be evaluated in isolation. A lower-priced supplier may create additional costs through delays, defects, rework, emergency freight, excessive administration, or inventory buffers.
| KPI | Formula | Example Target |
| Purchase Price Variance | Actual price compared with agreed price | Within contract tolerance |
| Total Cost of Ownership | Unit cost plus quality, logistics, delay, and administrative costs | Trending downward |
| Cost Improvement Contribution | Verified savings from supplier-led initiatives | Measured annually |
| Invoice Accuracy | Error-free invoices ÷ total invoices × 100 | Above 98% |
For many OEM relationships, total cost of ownership provides a more accurate view of supplier value than unit cost alone.
Responsiveness should measure communication quality
Responsiveness is partly qualitative, but it can still be measured consistently.
| KPI | Measurement | Example Target |
| RFQ Response Time | Average time to acknowledge or answer an RFQ | Within the agreed service level |
| Urgent Issue Response | Time to acknowledge critical problems | Within hours, not days |
| Problem Resolution Time | Average time to contain and resolve issues | Based on issue severity |
| Proactive Communication | Timely supplier-initiated updates | Consistent throughout the review period |
| Flexibility | Ability to manage changes or urgent requirements | Scored using defined criteria |
The goal is not to reward frequent communication without substance. The score should reflect whether information is timely, accurate, proactive, and useful for decision-making.
Risk and compliance should reflect the supplier’s exposure
Risk metrics should be tailored to the product, industry, country, and supply chain.
| KPI | Measurement | Example Target |
| Regulatory Compliance | Products meeting applicable requirements | 100% |
| Quality Management Certification | Valid certification and audit status | Appropriate to the industry |
| Business Continuity Planning | Documented and tested continuity procedures | Reviewed at least annually |
| Financial Risk | Agreed financial-risk indicator | Within the approved range |
| Cybersecurity Posture | Assessment against an accepted framework | Appropriate to the identified risk |
ISO 9001 is widely used as a quality management system standard, while sector-specific systems may apply to medical devices or automotive manufacturing. Certification should be verified for its scope, issuing body, validity, and relevance to the production site.
For cybersecurity risk, companies may use frameworks such as NIST CSF 2.0 to define and communicate supplier requirements.
Innovation should measure supplier-led improvement
Innovation metrics help distinguish a strategic manufacturing partner from a supplier that only executes purchase orders.
| KPI | Measurement | Example Target |
| Improvement Proposals | Practical value-engineering or process proposals | Reviewed annually |
| Implemented Savings | Verified savings from approved improvements | Trending upward |
| Joint Development Projects | Active co-development programmes | Based on relationship scope |
| Process Improvement | Documented improvements to quality, capacity, or efficiency | Demonstrated during reviews |
| Technology Adoption | Relevant use of automation or digital systems | Appropriate to the operation |
Only implemented or technically viable proposals should receive a strong score. Counting suggestions without considering their value can encourage activity rather than meaningful improvement.
How Should OEM Supplier Scorecard KPIs Be Weighed?
KPI weighting should reflect the consequences of supplier failure and the strategic priorities of the business.
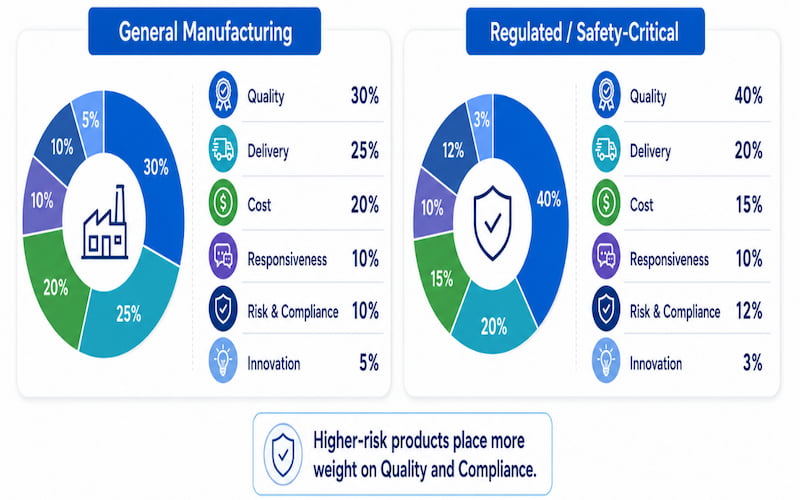
A general industrial or consumer product scorecard might use the following starting point:
| Category | Example Weight |
| Quality | 30% |
| Delivery | 25% |
| Cost | 20% |
| Responsiveness | 10% |
| Risk and Compliance | 10% |
| Innovation | 5% |
A regulated or safety-critical product may require a different balance:
| Category | Example Weight |
| Quality | 40% |
| Delivery | 20% |
| Cost | 15% |
| Responsiveness | 10% |
| Risk and Compliance | 12% |
| Innovation | 3% |
These are illustrative models, not fixed industry standards. Weighting should be agreed internally before suppliers are scored and should remain consistent throughout the review period.
Changing weights after reviewing the results can distort comparisons and undermine confidence in the process.
How Is a Composite Supplier Score Calculated?
Each KPI is assigned:
- A performance result
- A normalized score, commonly from 0 to 100
- A percentage weight
The weighted contribution is calculated by multiplying the score by its weight. The contributions are then added together.
For example:
| KPI | Score | Weight | Weighted Contribution |
| Defect Rate | 90 | 15% | 13.50 |
| First-Pass Yield | 92 | 15% | 13.80 |
| On-Time Delivery | 88 | 20% | 17.60 |
| Lead-Time Accuracy | 95 | 5% | 4.75 |
| Total Cost of Ownership | 90 | 20% | 18.00 |
| Responsiveness | 85 | 10% | 8.50 |
| Compliance and Risk | 85 | 10% | 8.50 |
| Innovation | 95 | 5% | 4.75 |
| Composite Score | 100% | 89.40 |
The company should define performance bands before applying the scorecard. An example classification is:
| Composite Score | Example Status |
| 90–100 | Strategic |
| 75–89 | Approved |
| 60–74 | Conditional |
| Below 60 | At risk |
A composite score should never hide a critical failure. A supplier with a strong overall result but a serious regulatory, safety, or quality issue may still require immediate escalation.
Which Contract Manufacturer KPIs Are Commonly Missed?
General supplier scorecards sometimes overlook the operational realities of contract manufacturing. The following metrics can provide a more complete picture.

Engineering change response should track implementation accuracy
Measure how quickly and accurately the supplier reviews, approves, documents, and introduces engineering changes.
The KPI should distinguish between:
- Time to acknowledge the change
- Time to complete the technical review
- Time to update tooling or processes
- Time to validate the revised part
- Accuracy of document and revision control
Tooling maintenance should measure production readiness
A supplier may meet quality targets while tooling is new but experience gradual performance deterioration as tooling wears.
The scorecard can track:
- Preventive maintenance completion
- Tooling condition
- Remaining useful life
- Calibration status
- Replacement planning
- Ownership and storage records
Capacity transparency should identify delivery risk
The supplier should provide enough visibility for the buyer to understand whether confirmed orders can be supported.
Useful measurements include:
- Available production hours
- Current utilization
- Bottleneck processes
- Surge capacity
- Planned shutdowns
- Dependency on shared equipment
Sub-supplier management should cover lower-tier risks
Contract manufacturers often rely on sub-suppliers for materials, treatments, coatings, machining, packaging, or testing.
The scorecard should evaluate whether the contract manufacturer:
- Approves and monitors sub-suppliers
- Maintains material traceability
- Controls outsourced processes
- Communicates significant changes
- Investigates lower-tier quality failures
- Maintains alternative sources where appropriate
Production audits should measure process control
Internal audit frequency alone is not enough. The scorecard should also evaluate whether findings are documented, corrective actions are completed, and recurring issues are prevented.
Certifications should be verified, not simply recorded
Quality system certifications should match the production site and the work being performed. Buyers should verify:
- Certificate validity
- Scope of certification
- Facility address
- Issuing certification body
- Open audit findings
- Corrective action status
Sustainability performance should use measurable evidence
Where sustainability is relevant to the sourcing decision, the scorecard may assess energy consumption, waste, water use, emissions data, material sourcing, or environmental management practices.
Targets should be proportionate to the supplier’s activities and based on data the supplier can reliably support.
How Can a Supplier Scorecard Be Put into Practice?
A scorecard only creates value when it is connected to accurate data, supplier reviews, and defined actions.
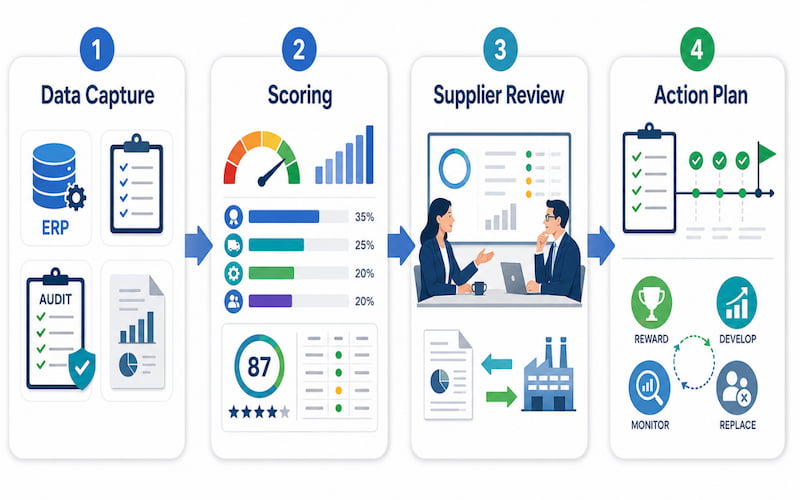
Step 1: Capture reliable supplier data
Possible data sources include:
- ERP purchase order and delivery records
- Quality inspection and non-conformance reports
- Customer complaint and return data
- Supplier self-assessments
- On-site audits
- Third-party compliance assessments
- Logistics and invoice records
Automated data should be used where possible, but it must still be checked for incorrect dates, duplicate records, incomplete transactions, and inconsistent definitions.
Step 2: Apply the agreed scoring model
Each KPI should have documented performance bands. For example, on-time delivery might receive:
| Result | Score |
| 98% or higher | 100 |
| 95%–97.9% | 90 |
| 90%–94.9% | 75 |
| 85%–89.9% | 60 |
| Below 85% | 40 |
The thresholds should reflect the company’s operational requirements rather than generic targets copied from another organization.
Step 3: Review results with the supplier
Scorecards should be shared with suppliers rather than used only as internal records.
A structured supplier review can cover:
- Current score and previous-period trend
- Strong-performing areas
- KPI gaps
- Root causes
- Corrective actions
- Responsible owners
- Completion dates
- Support required from the buyer
- Commercial consequences or opportunities
The supplier should be able to question inaccurate data and provide relevant operational context. However, explanations should not replace corrective action where performance repeatedly falls below the agreed target.
Step 4: Connect scores to sourcing decisions
A practical action model may include:
| Supplier Status | Possible Action |
| Strategic | Additional volume, longer agreements, early involvement, joint development |
| Approved | Maintain business, monitor trends, target selected improvements |
| Conditional | Formal improvement plan, closer reviews, backup sourcing |
| At Risk | Escalation, order reduction, replacement qualification, controlled transition |
The action should also reflect the severity of individual failures. A critical compliance issue may require escalation regardless of the composite score.
What Supplier Scorecard Mistakes Should Be Avoided?
Too many KPIs reduce focus
A scorecard containing dozens of measurements can become difficult to maintain and even harder to act on. Select KPIs that directly support quality, delivery, cost, risk, and strategic objectives.
Cost-only weighting creates the wrong incentives
Overweighting unit price can encourage suppliers to reduce inspection, maintenance, staffing, or capacity. Total cost, quality, and delivery should remain visible in the final evaluation.
Scores without action lose credibility
Suppliers are unlikely to prioritize a scorecard when strong performance receives no recognition and repeated underperformance produces no consequences.
Infrequent reviews allow problems to grow
Annual reviews may be sufficient for low-risk suppliers, but strategic or high-risk contract manufacturers normally require more frequent monitoring.
Excluding supplier input creates blind spots
Suppliers can help identify unrealistic targets, incorrect data, shared constraints, and process problems caused by the buyer. Their input should inform the review without weakening accountability.
Inconsistent scoring makes comparisons unreliable
Suppliers within the same category should be evaluated using the same definitions, formulas, periods, and evidence requirements.
What Are the Four Levels of Supplier Scorecard Maturity?
Companies generally progress through four levels as their supplier performance process becomes more structured.
Level 1: Ad hoc measurement
Performance information is spread across emails, spreadsheets, ERP reports, and individual knowledge. Reviews happen mainly when a problem occurs.
Level 2: Standardized scoring
A common scorecard is used across relevant suppliers. Reviews follow a defined schedule, and KPIs have documented formulas.
Level 3: Operationalized management
Data capture and calculations are partly automated. Suppliers receive regular feedback, and corrective actions are tracked to completion.
For casting suppliers, the evaluation may also include process-specific data such as mould consistency, pouring controls, heat treatment records, material traceability, machining allowances, and non-destructive testing results. These factors are particularly relevant when reviewing suppliers providing sand casting in Thailand or other regionally managed casting services.
Level 4: Strategic integration
Scorecard results influence sourcing strategy, supplier development, order allocation, risk management, consolidation, and joint improvement projects.
At this level, supplier reviews can also guide decisions about which manufacturing process is most suitable for a component. For example, understanding available investment casting materials helps buyers evaluate whether a supplier can meet the required strength, corrosion resistance, temperature performance, and dimensional accuracy.
How Should Metal Manufacturers Prepare for Scorecard Reviews?
Metal manufacturers should understand how their customers define success and ensure that performance evidence is accurate, traceable, and easy to review.
Preparation should include:
- Agreeing on KPI definitions before production begins
- Maintaining inspection and delivery records
- Monitoring trends rather than waiting for quarterly reviews
- Documenting corrective actions and their effectiveness
- Providing early notice of capacity or material risks
- Verifying sub-supplier controls
- Preparing evidence for quality and compliance claims
- Proposing realistic process or cost improvements
For suppliers providing metal fabrication in Thailand, scorecards may cover weld quality, dimensional accuracy, fabrication tolerances, material certificates, surface finishing, assembly quality, and production lead times.
Material and process controls should also match the component’s intended application. Projects involving sand casting stainless steel may require additional attention to alloy verification, casting integrity, heat treatment, corrosion performance, machining, and inspection documentation.
The strongest scorecard reviews examine more than the final shipment. They assess whether the supplier has stable processes, effective quality controls, appropriate equipment, qualified personnel, and the ability to prevent recurring problems.
Conclusion
At Align Manufacturing, we produce precision metal parts and components through sand casting, investment casting, CNC machining, forging, stamping, die casting, and metal fabrication for industries including oil and gas, railway, construction, truck and trailer, and industrial manufacturing. We believe an effective OEM supplier scorecard should evaluate the factors that directly affect metal component performance, including material quality, dimensional accuracy, defect rates, process control, delivery reliability, compliance, communication, and continuous improvement. By combining reliable production data with transparent supplier reviews and clearly defined actions, manufacturers can reduce sourcing risks and build more dependable long-term relationships.
FAQ
What is an OEM supplier scorecard?
An OEM supplier scorecard is a structured tool used to measure a contract manufacturer’s performance across agreed KPIs, such as quality, delivery, cost, responsiveness, compliance, risk, and continuous improvement.
How many KPIs should a supplier scorecard include?
There is no universal number, but a focused scorecard is generally more effective than one containing too many measurements. Select enough KPIs to cover the main operational and strategic risks without making the process difficult to maintain.
What is a good supplier scorecard result?
A good result is one that meets the company’s predefined performance threshold without hiding critical quality, safety, or compliance failures. Many organizations use categories such as strategic, approved, conditional, and at risk, but the numerical boundaries should be defined internally.
How often should supplier scorecards be reviewed?
Review frequency should depend on supplier importance and risk. Strategic or underperforming suppliers may require monthly or quarterly reviews, while stable, lower-risk suppliers may be reviewed less frequently.
What is the most important supplier scorecard KPI?
Quality and delivery are usually among the most important categories, but the weighting should reflect the product and its risks. Safety-critical and regulated products may require greater weighting for quality and compliance.
What is the difference between a supplier scorecard and a supplier audit?
A supplier audit assesses capabilities, processes, controls, or compliance at a particular point in time. A supplier scorecard tracks actual performance over a defined period. Audit findings can contribute to the scorecard, but the two tools serve different purposes.
How do supplier scorecards support sustainability reporting?
Supplier scorecards can collect relevant information about environmental performance, compliance, sourcing practices, and value-chain risks. However, the required data depends on the company’s jurisdiction, reporting obligations, materiality assessment, and applicable standards.
Should small companies use supplier scorecards?
Yes. A small company can use a simplified scorecard containing a few essential KPIs. The process can begin in a spreadsheet as long as the definitions are consistent, the data is reliable, and the results lead to action.
What software can be used for supplier scorecards?
Supplier scorecards can be managed through ERP systems, supplier management platforms, quality management systems, business intelligence tools, or spreadsheets. The process, data quality, and follow-up actions are more important than the platform itself.