
Posts Tagged ‘Metal Manufacturing’
Gage R&R Studies for Machine Shops: A Practical Implementation Guide
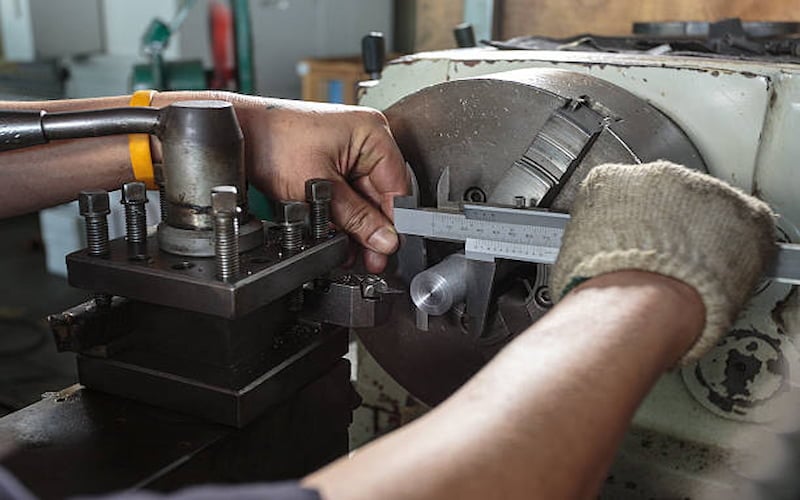
When two machinists measure the same shaft and report different diameters, the problem may not be the part. It may come from the gage, measurement method, operator technique, fixture, temperature, or inspection environment.
A Gage Repeatability and Reproducibility study, commonly called Gage R&R, separates actual part-to-part variation from variation introduced by the measurement system. This helps machine shops determine whether inspection data is reliable enough for process control, capability studies, production approval, and part acceptance.
This guide explains how Gage R&R works, which study design to use, how to interpret the results, and what to do when a measurement system performs poorly.
What Is a Gage R&R Study?
Gage R&R is part of the broader Measurement System Analysis (MSA) framework. It evaluates two primary sources of measurement variation:
- Repeatability: Variation when the same operator measures the same part repeatedly with the same equipment under the same conditions
- Reproducibility: Variation when measurement conditions change, commonly when different operators use the same system
A typical machine-shop study also estimates part-to-part variation, which is the actual dimensional difference among the selected components.
The observed variation can therefore be viewed as:
Total observed variation = part-to-part variation + measurement-system variation
The purpose is not to eliminate every difference between readings. It is to confirm that measurement error is small enough to support the intended manufacturing decision.
Why Do Machine Shops Need Gage R&R?
Machine shops rely on measurement results to:
- Approve first articles
- Accept or reject finished parts
- Monitor critical dimensions
- Calculate process capability
- Maintain SPC charts
- Investigate non-conformances
- Support PPAP submissions
- Resolve customer or supplier disputes
When the measurement system is inadequate, these decisions can become unreliable. A conforming component may be rejected, a non-conforming component may be accepted, or a stable machining process may appear inconsistent.
Gage R&R is especially important for:
- Tight-tolerance dimensions
- Customer-designated special characteristics
- Measurements listed in a Control Plan
- New inspection equipment
- New or modified fixtures
- Manual gages affected by operator technique
- Features with difficult access or inconsistent datum placement
What Does Gage R&R Show That Calibration Does Not?

Calibration and Gage R&R answer different questions.
Calibration asks: Does the instrument provide an acceptable result when compared with a traceable reference?
Gage R&R asks: Can the complete measurement system produce sufficiently consistent results when used on actual production parts?
A calibrated micrometer may still produce inconsistent shop-floor results because of:
- Different contact pressure
- Different measurement locations
- Incorrect alignment
- Part cleanliness
- Burrs or surface finish
- Fixture variation
- Temperature differences
- Inconsistent work instructions
- Operator interpretation
A gage can therefore remain within calibration and still perform poorly in a Gage R&R study.
Which Type of Gage Study Should You Use?
The correct study depends on the type of data and whether the same part can be measured repeatedly.
Variable Gage R&R uses numerical measurements
A variable study is appropriate when the result is a continuous numerical value, such as:
- Diameter
- Length
- Flatness
- Runout
- Surface roughness
- Hardness
- Coating thickness
- Thread pitch diameter
A common crossed study uses:
- 10 representative parts
- 2–3 operators
- 2–3 trials per part
This produces 40–90 readings, depending on the selected design.
The sample should represent the actual process variation expected during production. Selecting several nearly identical parts can make the measurement system appear worse because there is too little part-to-part variation for the gage to distinguish.
Attribute studies use categorical decisions
An attribute study is appropriate when inspectors classify parts rather than record a numerical value.
Examples include:
- Pass or fail
- Go or no-go
- Acceptable or unacceptable appearance
- Surface classification
- Defect category
The study evaluates agreement:
- Within each operator’s repeated decisions
- Between operators
- Between operators and a known reference decision
A common attribute agreement design uses approximately 30 parts, including clearly acceptable, clearly unacceptable, and borderline examples. The exact number of parts, operators, and trials should reflect the inspection risk and customer requirements.
Crossed studies reuse the same parts
Use a crossed Gage R&R study when every operator can measure every part more than once.
This is common for:
- Micrometer measurements
- Caliper measurements
- Bore-gage measurements
- CMM inspection
- Non-destructive surface-finish testing
Nested studies suit destructive measurements
Use a nested study when the same part cannot be measured repeatedly or cannot be measured by every operator.
Examples may include:
- Tensile testing
- Destructive sectioning
- Certain hardness or coating tests
- Tests that permanently alter the sample
In a nested design, each operator measures different parts drawn from an equivalent production group. The statistical structure differs from a crossed study, so the analysis should be configured accordingly.
How Should Gage R&R Results Be Interpreted?

The most common outputs include:
- Total Gage R&R
- Repeatability
- Reproducibility
- Part-to-part variation
- Percentage of study variation
- Percentage of tolerance
- Number of distinct categories
- Operator-by-part interaction
These results should be reviewed together rather than relying on one percentage.
What does percentage of study variation mean?
%Study Variation compares the measurement-system variation with the total observed variation in the study.
Common interpretation guidelines are:
| Total Gage R&R | General Interpretation |
| Less than 10% | Generally acceptable |
| 10–30% | May be acceptable depending on application, cost, risk, and customer requirements |
| Greater than 30% | Generally unacceptable and should be improved |
A result between 10% and 30% is not automatically approved. The decision should consider:
- Feature criticality
- Tolerance width
- Process capability
- Inspection cost
- Risk of misclassification
- Customer-specific limits
- Availability of a better measurement method
What does percentage of tolerance mean?
%Tolerance compares measurement-system variation with the engineering tolerance.
This is useful when the main purpose is deciding whether parts meet a specification. A system can perform reasonably against the variation in the selected parts but still consume too much of a tight tolerance.
For example, a study based on parts with a broad dimensional range may produce a good %Study Variation result. However, if the measurement variation is large compared with the drawing tolerance, the system may still be unsuitable for final acceptance.
What is the number of distinct categories?
The number of distinct categories, or NDC, estimates how many separate groups of parts the measurement system can reliably distinguish.
An NDC of five or more is generally used as an indication that the system has adequate discrimination. An NDC below five may indicate that the measurement system cannot separate meaningful differences among production parts.
Why should interaction be reviewed?
Operator-by-part interaction occurs when operators measure particular parts differently rather than showing one consistent difference across all parts.
Possible causes include:
- Inconsistent datum selection
- Difficult feature access
- Part-specific burrs
- Uneven surface finish
- Fixture sensitivity
- Different interpretation of the inspection method
Complex GD&T requirements can increase this risk when operators do not use the same datum structure or inspection sequence. Align Manufacturing’s guide to balloon drawings and GD&T for First Article Inspection explains how drawing characteristics can be connected to consistent inspection methods.
Should You Use Average and Range or ANOVA?
Both methods can estimate measurement-system variation, but they provide different levels of detail.
Average and Range is simpler
The Average and Range method is easier to calculate manually or through a spreadsheet.
It may be suitable for:
- Basic screening
- Established measurement methods
- Small studies
- Shops without statistical software
Its main limitation is that it does not estimate operator-by-part interaction separately.
ANOVA provides more detail
The ANOVA method separates variation associated with:
- Parts
- Operators
- Repeatability
- Operator-by-part interaction
It can therefore provide a more complete view of the measurement system, particularly when manual technique or difficult features may affect individual parts differently.
How Do You Run a Variable Gage R&R Study?
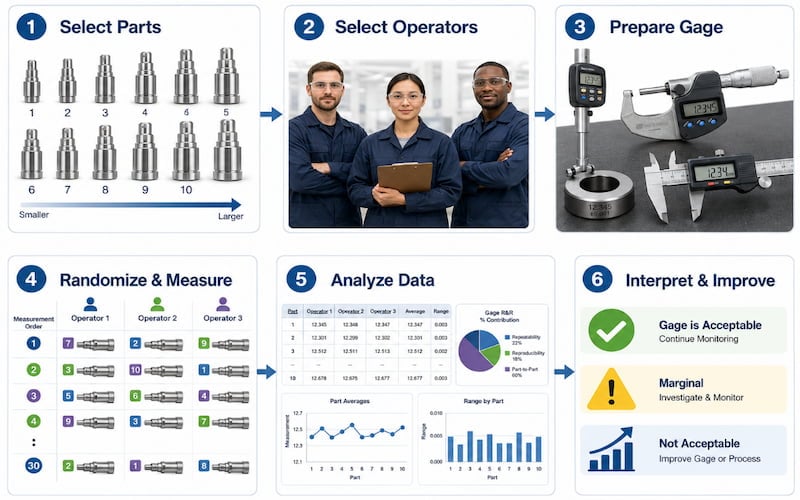
Step 1: Define the measurement system
Document exactly what is being evaluated:
- Part number
- Drawing characteristic
- Specification and tolerance
- Measurement equipment
- Fixture
- Inspection method
- Measurement location
- Operators
- Environmental conditions
The study should represent the method used during normal production.
Step 2: Select representative parts
Choose parts that span the expected production range.
Avoid selecting:
- Ten consecutive pieces that are nearly identical
- Only parts close to nominal
- Parts with unstable dimensions
- Damaged parts that would not normally be inspected
- Samples that operators can easily identify
The purpose is to test whether the system can distinguish actual production differences.
Step 3: Select normal operators
Use operators who routinely perform the inspection. Do not select only the most experienced inspector unless that person is the only authorised user of the system.
The study should represent actual operating conditions.
Step 4: Confirm calibration and resolution
Before the study:
- Confirm that calibration is current
- Inspect the equipment for damage or wear
- Verify the correct measurement range
- Check fixture condition
- Confirm that the display resolution is appropriate
- Review the measurement procedure
A common rule of thumb is that gage discrimination should be approximately one-tenth of the tolerance or expected process variation. This should be treated as a practical starting point, not a substitute for analysing the completed measurement system.
Step 5: Randomise the measurements
Randomisation reduces memory and sequence bias.
During the study:
- Hide the sample identities where practical
- Change the order for each operator and trial
- Prevent operators from seeing previous results
- Use the normal measurement procedure
- Record readings immediately
- Do not average repeated readings before analysis
The dataset should include:
| Part | Operator | Trial | Measurement |
| 01 | A | 1 | 25.021 |
| 01 | B | 1 | 25.028 |
| 01 | A | 2 | 25.023 |
Step 6: Analyse the results
Review:
- Total Gage R&R
- Repeatability
- Reproducibility
- Part-to-part variation
- %Study Variation
- %Tolerance
- NDC
- R chart
- X̄ chart
- By-operator graph
- Operator-by-part interaction
Do not approve or reject the system from one output alone.
Step 7: Identify and correct the main source of variation
| Result Pattern | Possible Cause | Potential Action |
| High repeatability variation | Equipment, fixture, resolution, or method issue | Repair or replace the gage, improve fixturing, or change the method |
| High reproducibility variation | Operators use the method differently | Standardise the procedure and retrain operators |
| Significant interaction | Certain features are measured inconsistently | Review datum location, access, fixturing, and part-specific technique |
| Low part-to-part variation | Samples do not represent the process range | Select a more representative part set |
| High %Tolerance | System consumes too much of the specification | Use higher-resolution equipment or redesign the inspection method |
After corrective action, repeat the study to confirm that performance has improved.
What Mistakes Can Invalidate a Gage R&R Study?
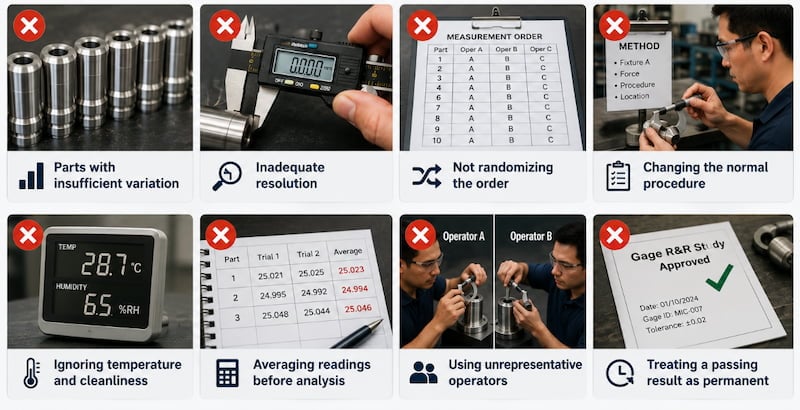
Selecting parts with insufficient variation
When all selected parts are nearly identical, part-to-part variation becomes artificially small and Total Gage R&R may appear disproportionately high.
Select samples that represent the actual operating range without deliberately manipulating the study.
Using inadequate resolution
A low-resolution caliper may not be suitable for a tight bore, runout, or thickness tolerance.
The display may appear stable while hiding smaller but important differences among parts.
Failing to randomise the order
Measuring every part in the same sequence can allow operators to remember or anticipate earlier readings.
Randomise the parts for every trial.
Changing the normal procedure during the study
A study conducted in a laboratory by a quality engineer may not represent the measurement process used by production operators.
Use the same:
- Equipment
- Fixture
- Work instruction
- Environment
- Part preparation
- Operator method
Ignoring temperature and cleanliness
Metal components, especially aluminium and large precision parts, can change dimension with temperature. Coolant, chips, oil, burrs, and dirt can also affect contact measurements.
The study should reflect the controlled conditions required by the actual inspection process.
Averaging readings before analysis
Entering an average instead of individual observations removes information needed to estimate repeatability.
Record every reading separately.
Treating a passing result as permanent
Measurement systems can change because of:
- Equipment wear
- Fixture damage
- Software updates
- Operator changes
- New part geometry
- Process relocation
- Revised tolerances
Gage R&R should be repeated when significant changes could affect measurement performance.
What Should a Gage R&R Template Include?
A practical spreadsheet or software template should contain:
- Study information and characteristic details
- Part, operator, trial, and measurement columns
- Specification and tolerance fields
- ANOVA or Average and Range calculations
- Total Gage R&R results
- Repeatability and reproducibility results
- Part-to-part variation
- %Study Variation
- %Tolerance
- NDC
- Components-of-variation graph
- R and X̄ charts
- Operator and interaction graphs
- Acceptance decision and corrective-action fields
The formula cells should be protected to prevent accidental changes, while the study assumptions and acceptance criteria should remain visible.
How Do Different Industries Apply Gage R&R?
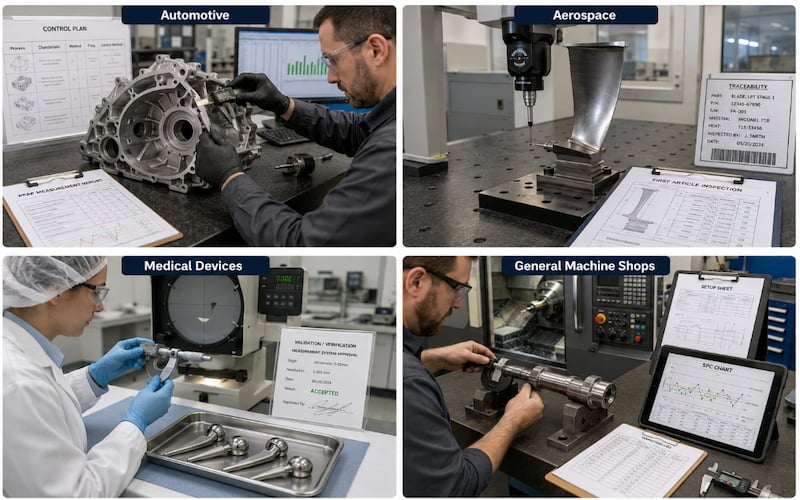
Automotive manufacturing
Automotive suppliers commonly use Gage R&R as part of MSA, APQP, Control Plan development, and PPAP.
Customer-specific requirements may define:
- Characteristics requiring a study
- Submission format
- Acceptance limits
- Required operators and trials
- Revalidation frequency
- Approved calculation method
General guidance should not replace a customer’s specific requirements.
Aerospace manufacturing
Aerospace machine shops may place additional emphasis on:
- Measurement traceability
- Environmental control
- Inspection planning
- First Article Inspection
- Measurement uncertainty
- Special-process verification
The required method should be defined by the customer, quality plan, and applicable standard rather than assumed from automotive practice.
Medical-device manufacturing
Medical-device manufacturers may use measurement-system studies to support:
- Process validation
- Inspection-method validation
- Risk management
- Production acceptance
- Regulatory documentation
The study design should reflect the measurement risk and intended decision.
General precision machining
Job shops should prioritise Gage R&R for:
- Tight-tolerance dimensions
- Repeated production work
- High-value components
- Functional interfaces
- Customer complaints
- New equipment or fixtures
- Characteristics used for process capability
Align Manufacturing’s precision machining in Thailand overview explains how inspection and process control support repeatable production of tight-tolerance metal components.
How Does Gage R&R Support APQP and PPAP?
Gage R&R should be connected to the wider product-quality planning process rather than completed as an isolated statistical exercise.
During process development, the team should identify:
- Which characteristics require measurement studies
- Which gages and fixtures will be used
- When studies must be completed
- Which acceptance criteria apply
- How failing systems will be improved
- Which records must be included in PPAP
A Gage R&R study should be completed before its measurement data is used for:
- Capability studies
- Full dimensional layouts
- Production trials
- PPAP submission
- Customer approval
Using an unreliable measurement system to calculate capability can make Cpk or Ppk results misleading.
Align Manufacturing’s guide to PPAP Levels 1–5 for CNC machining suppliers explains where MSA evidence fits within the production-approval package.
How Should Gage R&R Connect to the Process Flow and Control Plan?
The measurement method should match the manufacturing and inspection sequence shown in the approved quality documents.
The Process Flow Diagram should show where inspection takes place. The PFMEA should identify measurement-related risks, and the Control Plan should define:
- Characteristic being checked
- Gage or inspection method
- Sample frequency
- Control limit
- Responsible operator
- Reaction plan
Align Manufacturing’s guide to process flow diagrams for CNC machining explains how process steps, inspection points, PFMEA controls, and Control Plan requirements should remain aligned.
When the measurement method changes, all related documents should be reviewed together.
How Should Gage R&R Records Be Controlled?
The study should remain linked to the current:
- Part number
- Drawing revision
- Characteristic
- Control Plan
- Inspection instruction
- Gage identification
- Fixture identification
- Calibration record
- Software version
- Operator group
- Corrective-action record
A measurement study can become invalid when the approved method changes but the supporting record is not updated.
Align Manufacturing’s guide to manufacturing documentation control and material traceability explains how inspection records, revisions, approvals, and production evidence can be maintained under a controlled quality system.
What Should Happen When a Gage R&R Study Fails?
A failed result should lead to a documented investigation rather than an immediate decision to replace the gage.
The team should first determine whether the main source is:
- Equipment variation
- Operator variation
- Fixture instability
- Inadequate resolution
- Incorrect part selection
- Environmental variation
- Incomplete instructions
- Difficult feature access
- Operator-by-part interaction
Possible corrective actions include:
- Repairing or replacing the gage
- Improving the fixture
- Clarifying the measurement location
- Adding visual work instructions
- Training operators
- Controlling temperature
- Cleaning parts before inspection
- Moving the measurement to a CMM or automated system
- Redesigning the inspection method
The improvement should be verified through a repeated study. Align Manufacturing’s article on internal auditing and CAPA for machine shops explains how measurement failures can be documented, investigated, corrected, and checked for effectiveness.
How Can Operators Improve Measurement Consistency?
Operator training should define:
- How the part is cleaned
- How long it must stabilise
- Which datum is used
- Where the feature is measured
- How the gage is aligned
- How much contact force is applied
- How the result is read
- How the reading is recorded
- What action is required for an unusual result
Photos, diagrams, master samples, fixtures, and short work instructions often provide better consistency than a long written procedure alone.
For assemblies combining machining with cutting, forming, welding, or secondary operations, Metal Fabrication Thailand inspection plans may require separate measurement studies for each critical process stage.
How Does Gage R&R Support an ISO 9001 Quality System?
Gage R&R can support a wider quality management system by providing evidence that monitoring and measurement activities are suitable for their intended purpose.
The process should connect with:
- Equipment calibration
- Competency and training
- Inspection planning
- Control of documented information
- Non-conformance management
- Corrective action
- Internal auditing
- Management review
Align Manufacturing’s guide to implementing ISO 9001 for job shop manufacturing explains how these controls can be integrated into a practical machine-shop quality system.
What Should Be Checked Before Starting a Gage R&R?
- The characteristic and tolerance are clearly defined
- The inspection method matches normal production
- Calibration is current
- Gage resolution is suitable
- The fixture is stable and identified
- Representative parts have been selected
- Operators routinely use the measurement system
- The work instruction is current
- Parts will be measured in random order
- Operators cannot see previous results
- Environmental conditions are controlled where necessary
- Acceptance criteria are agreed before data collection
- Corrective actions will be documented
- The study will be repeated after significant improvements
Conclusion
At Align Manufacturing, we produce precision metal components through CNC machining, casting, forging, stamping, and fabrication. We use controlled inspection methods, calibrated equipment, documented procedures, and measurement-system studies to confirm that dimensional data is reliable before it is used for part acceptance, capability analysis, or production approval. We view Gage R&R as a practical tool for reducing measurement uncertainty, improving process decisions, and ensuring that customers receive components evaluated through a consistent and repeatable inspection system.
FAQ
What is a Gage R&R study?
A Gage R&R study evaluates how much measurement variation comes from the equipment and measurement method compared with actual differences among parts.
What is the difference between repeatability and reproducibility?
Repeatability is variation under the same measurement conditions. Reproducibility is variation when conditions change, commonly when different operators perform the measurement.
What is an acceptable Gage R&R result?
A Total Gage R&R below 10% is generally considered acceptable. Results between 10% and 30% may be acceptable depending on risk, cost, application, and customer requirements. Results above 30% generally require improvement.
How many parts are needed for a Gage R&R study?
A common crossed study uses 10 representative parts, 2–3 operators, and 2–3 trials. The design may need to change according to the process and customer requirements.
What does NDC mean?
NDC is the number of distinct categories that the measurement system can reliably distinguish. General AIAG guidance recommends at least five.
Can a calibrated gage fail Gage R&R?
Yes. Calibration confirms performance against a reference, while Gage R&R evaluates the complete measurement process using actual parts, operators, fixtures, and operating conditions.
Can one operator perform a Gage R&R study?
A one-operator study can assess repeatability but cannot evaluate reproducibility between operators. A complete crossed study normally includes at least two operators.
Should out-of-specification parts be included?
The selected parts should represent the range that the measurement system must distinguish. This may include samples near or outside specification limits when appropriate, but the selection should not be manipulated to force a favourable result.
When should a nested study be used?
Use a nested study when the same sample cannot be measured by every operator, commonly because the test destroys or permanently changes the part.
When should Gage R&R be repeated?
Repeat the study when the gage, fixture, method, software, operators, production location, part design, or tolerance changes in a way that may affect measurement performance.
C46400 Naval Brass: Corrosion Resistance for Marine Fittings
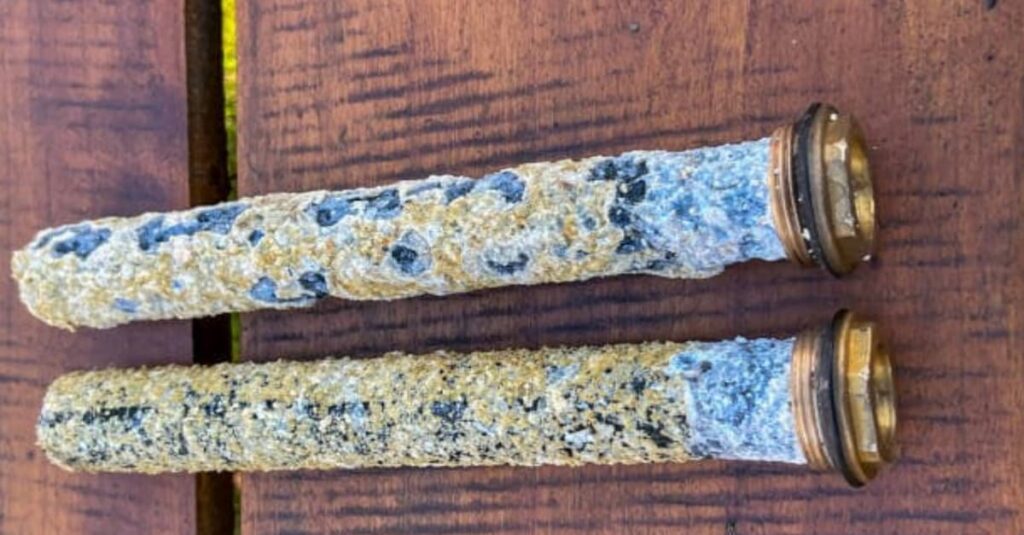
C46400 naval brass is a copper-zinc-tin alloy used for marine fittings, valve components, fasteners, condenser parts, and other equipment exposed to seawater or coastal conditions. Its tin content improves corrosion resistance compared with standard brasses, while its strength and hot-working characteristics support demanding marine applications.
However, C46400 is not suitable for every seawater system. Flow velocity, water chemistry, mechanical loading, manufacturing method, and galvanic compatibility should all be considered before specifying it.
This guide explains the alloy’s composition, specifications, applications, manufacturing considerations, sourcing requirements, and practical limitations.
Why Does Tin Improve C46400’s Marine Performance?
C46400 is a wrought naval brass with the following chemical composition, according to the Copper Development Association:

| Element | C46400 Range |
| Copper | 59.0–62.0% |
| Tin | 0.50–1.00% |
| Lead | 0.20% maximum |
| Iron | 0.10% maximum |
| Zinc | Remainder |
Tin helps reduce dezincification
Dezincification is a form of selective corrosion in which zinc is removed from brass, leaving a porous copper-rich structure with reduced mechanical strength.
The addition of tin improves C46400’s resistance to this process, making it more suitable for marine exposure than unstabilised high-zinc brasses.
Its performance still depends on:
- Water temperature and chemistry
- Flow velocity
- Oxygen and sulphide levels
- Mechanical stress
- Surface condition
- Contact with dissimilar metals
C46400 should therefore be selected according to the complete operating environment rather than its alloy name alone.
How much tin does C46400 contain?
C46400 contains 0.50–1.00% tin by weight, with copper at 59.0–62.0% and zinc making up most of the balance. The mill certificate should confirm that the supplied heat falls within these limits.
Which Specifications Apply to C46400 Naval Brass?
The correct material specification depends on the purchased product form.
| Product Form | Common Specification | Typical Use |
| Rod, bar, and shapes | ASTM B21/B21M | Machined fittings, stems, shafts, and hardware |
| Hot-forging material | ASTM B124/B124M | Forged valve and fitting components |
| Plate and sheet | Applicable specification stated on the drawing | Condenser plates, baffles, and fabricated components |
The drawing and purchase order should state:
- UNS alloy designation
- Applicable material specification
- Product form
- Temper
- Dimensions and tolerances
- Required mechanical properties
- Testing requirements
- Certification and traceability requirements
Avoid specifying only “naval brass,” as this may not provide enough information to control the exact alloy, form, and condition supplied.
How does temper affect C46400?
Temper describes the material condition created through cold working or thermal processing. It can affect:
- Tensile and yield strength
- Ductility
- Machining behaviour
- Formability
- Dimensional stability
The selected temper should match the manufacturing process and final component requirements. A harder condition may provide greater strength but less formability.
Where Is C46400 Naval Brass Used?
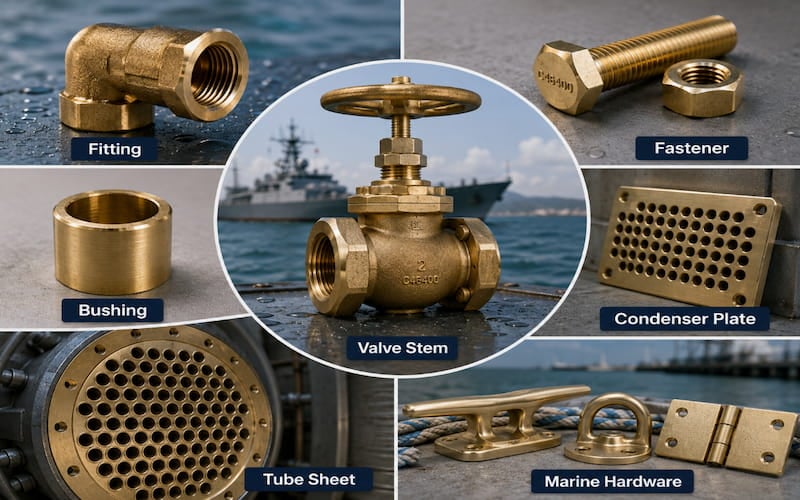
C46400 is generally selected for components requiring a combination of corrosion resistance, strength, formability, and reliable manufacturing performance.
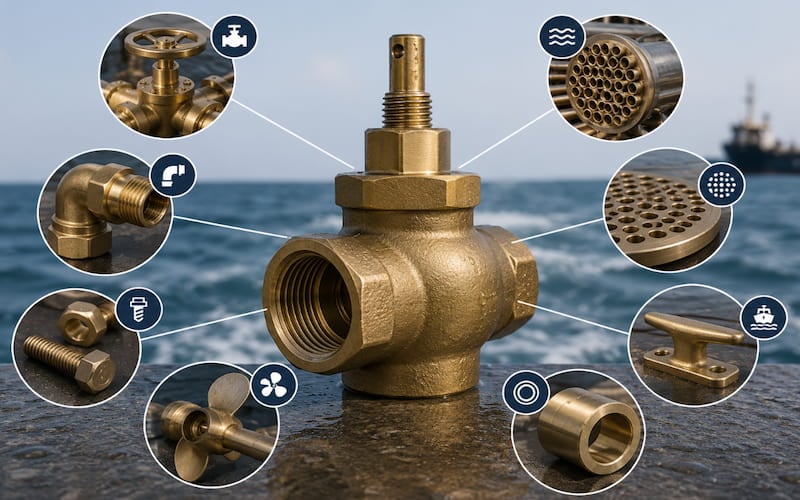
Common applications include:
- Marine valve stems and internal components
- Fittings and couplings
- Fasteners and lock pins
- Propeller-shaft components
- Condenser and heat-exchanger parts
- Tube sheets and baffle plates
- Marine hardware
- Bushings and wear components
- Coastal architectural hardware
Valves and fittings benefit from marine corrosion resistance
Valve and fitting components may be exposed to seawater, salt spray, condensation, and marine atmospheres. C46400 offers better resistance to these conditions than standard free-machining brass while retaining useful machining and hot-working characteristics.
The selected material must also suit the component’s:
- Pressure rating
- Wall thickness
- Joining method
- Operating temperature
- Flow conditions
- Required service life
Heat exchangers require careful material matching
C46400 may be used in heat-exchanger and condenser components where both strength and moderate thermal conductivity are required.
Naval brass has lower thermal conductivity than some standard brass alloys because of its tin and zinc content, but it offers improved mechanical strength and marine corrosion performance. Align Manufacturing’s article on brass thermal conductivity in heat exchangers provides a wider comparison of heat-transfer brass grades.
Is C46400 Suitable for Potable-Water Components?
C46400 has a maximum specified lead content of 0.20%. However, the lead percentage of the brass body alone does not prove that a finished product complies with potable-water requirements.
A finished component may also contain:
- Solder or brazing filler
- Plating
- Coatings
- Seals
- Thread compounds
- Other wetted metal parts
The complete product must therefore be assessed against the applicable weighted-average lead and certification requirements.
Where potable-water compliance is required, C46400 should be compared with dedicated low-lead alternatives rather than selected only from its nominal composition. Align Manufacturing’s guide to lead-free brass standards for manufacturing explains the relationship between alloy selection, production controls, and finished-product compliance.
How Does C46400 Compare With C36000 Brass?
| Property | C46400 Naval Brass | C36000 Free-Machining Brass |
| Primary advantage | Marine corrosion resistance | High-speed machining |
| Tin | 0.50–1.00% | Not intentionally added |
| Lead | 0.20% maximum | Approximately 2.5–3.7% |
| Machinability | About 30% of C36000 | Industry benchmark |
| Typical use | Marine and corrosion-exposed hardware | High-volume machined components |
C46400 and C36000 are designed for different priorities.C36000 prioritises machining efficiency
C36000 contains lead that assists chip breaking and reduces cutting friction. It is widely used when fast machining, good surface finish, and economical production are the main priorities.
It should not be substituted for C46400 in a marine application without a proper corrosion assessment.
C46400 prioritises marine performance
C46400 sacrifices machining speed in exchange for improved resistance to marine exposure. It may be more suitable for products exposed to:
- Seawater
- Brackish water
- Coastal spray
- Condensation
- Marine atmospheres
For a broader comparison of C36000, C46400, C48500, and other grades, refer to Align Manufacturing’s brass alloy guide for machining.
The final decision should consider material cost, machining time, expected service life, maintenance, and replacement risk.
When Should Another Marine Alloy Be Considered?
C46400 occupies a useful middle ground, but more demanding applications may require another copper alloy.
Aluminium bronze provides greater strength
Aluminium bronze may be more appropriate for highly loaded components, wear surfaces, propellers, or critical subsea equipment requiring greater strength and resistance to cavitation.
Align Manufacturing’s brass versus bronze material-selection guide compares the mechanical, corrosion, wear, and manufacturing characteristics of both alloy families.
Copper-nickel suits demanding seawater flow
Copper-nickel alloys are widely used for seawater piping, tube bundles, and cooling systems where uniform corrosion behaviour and resistance to flowing seawater are important.
Stainless steel may suit specific requirements
Selected stainless steel grades may provide greater strength or resistance to particular chemicals. However, chloride exposure, crevice conditions, and galvanic coupling still require careful evaluation.
For cast components, material selection should also reflect the process used to form the part. Align Manufacturing’s overview of investment casting materials explains how strength, corrosion resistance, castability, and finishing requirements affect alloy choice.
How Is C46400 Machined and Formed?
C46400 can be machined using conventional equipment, but it does not cut as quickly as free-machining C36000.
Machining parameters should be validated
Tooling and cutting conditions depend on:
- Product form and temper
- Component geometry
- Machine rigidity
- Tool material and coating
- Cutting depth
- Coolant strategy
- Surface-finish requirements
C46400 has a machinability rating of approximately 30% relative to C36000. It can also present work-hardening, galling, chip-control, and surface-finish risks when cutting conditions are poorly controlled.
Align Manufacturing’s article on brass PFMEA for CNC machining explains how alloy properties can be connected to tooling, dimensional, and machining-process risks.
Hot forming can reduce machining
Where the geometry and production volume justify it, hot forging can create a near-net shape before machining. This may reduce:
- Material waste
- Machining time
- Deep-pocket cutting
- Tool consumption
- Overall production cost
Tool design, forming temperature, material flow, trimming allowance, and final machining stock should be validated for the specific component.
Align Manufacturing’s guide to forging fundamentals provides additional context on material flow, grain structure, tooling, and near-net-shape manufacturing.
Casting may suit larger or more complex geometries
C46400 is primarily identified as a wrought alloy, so buyers should not assume that the same UNS designation is suitable for every casting process.
Where a complex marine part is produced as a casting, the engineering team should select an appropriate cast copper alloy and define:
- Alloy specification
- Casting process
- Pressure-integrity requirements
- Porosity acceptance
- Machining allowance
- Testing
- Heat and lot traceability
Buyers assessing regional foundry options can review Align Manufacturing’s overview of Sand casting in Thailand for additional process and sourcing context.
Joining requires control of zinc and filler materials
C46400 may be joined using suitable soldering or brazing processes. Welding requires greater care because zinc loss and porosity can affect joint quality.
The joining process should be supported by:
- Approved procedures
- Compatible filler materials
- Controlled heat input
- Qualified operators
- Inspection requirements
- Corrosion assessment
Surface treatments must also suit the alloy and marine environment. Align Manufacturing’s guide to brass surface finishes explains how polishing, plating, coating, and other treatments affect appearance, corrosion behaviour, and durability.
For complete assemblies involving cutting, forming, joining, machining, and finishing, experienced Metal Fabrication Thailand capabilities can help buyers assess the full production route rather than the raw alloy alone.
What Should Buyers Check When Sourcing C46400?
The purchase specification should state UNS C46400 together with the material standard relevant to the supplied product form.

Review the mill test report
The mill test report should include:
- Heat or lot number
- Copper content
- Tin content
- Lead content
- Iron content
- Zinc balance
- Mechanical properties where required
- Product form and temper
- Applicable material specification
- Manufacturer and testing location
The reported chemistry should remain within the specified C46400 limits.
Confirm material traceability
Traceability should continue from incoming material through finished production using:
- Material identification
- Cutting records
- Batch or work-order numbers
- Forming and machining records
- Inspection reports
- Final certification
- Packaging and shipment documents
Align Manufacturing’s guide to manufacturing documentation control and material traceability explains how drawings, material records, inspection results, revisions, and production evidence can be maintained as one controlled record.
Define the RFQ clearly
For custom components, the RFQ should identify:
- Alloy and material standard
- Drawing revision
- Annual and batch volumes
- Critical dimensions
- Surface finish
- Testing requirements
- Certification documents
- Machining allowances
- Packaging requirements
- Change-control expectations
Align Manufacturing’s guide to ordering custom castings provides a useful framework for preparing drawings, specifications, testing requirements, and supplier documentation before tooling begins.
Audit outsourced operations
Buyers should identify whether forging, machining, plating, heat treatment, testing, or assembly is performed by sub-suppliers.
Supplier qualification should review:
- Process capability
- Inspection equipment
- Material segregation
- Calibration
- Non-conformance controls
- Change management
- Document retention
What Are the Limitations of C46400?
C46400 should not be treated as a universal solution for every marine environment.
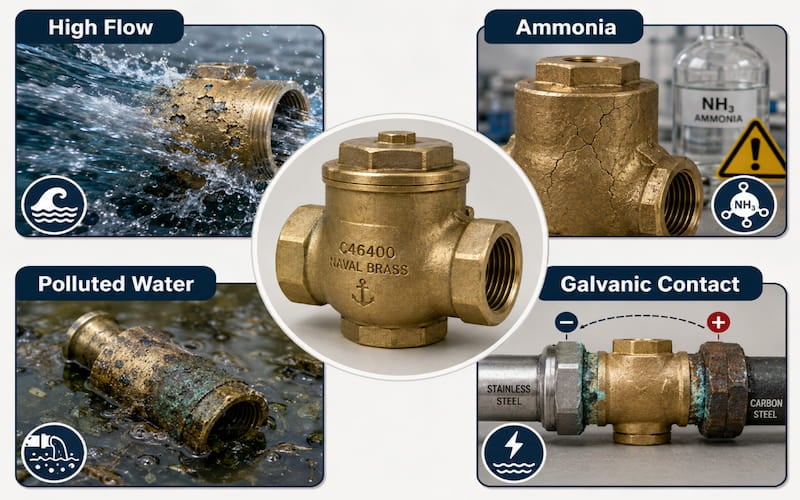
High flow can cause erosion-corrosion
Elevated water velocity, turbulence, entrained solids, and poor component geometry can remove protective surface films faster than they reform.
Pumps, elbows, restrictions, valve seats, and tube entrances deserve particular attention.
Ammonia can create cracking risk
Copper alloys can be vulnerable to stress-corrosion cracking in environments containing ammonia or related compounds, particularly when tensile stress is present.
The actual chemical environment should be reviewed before C46400 is used in systems containing ammonia or amines.
Polluted water may behave differently
Sulphides, biological activity, suspended solids, and low-oxygen conditions can change the corrosion behaviour of copper alloys.
Material selection should be based on representative water chemistry whenever the system handles polluted harbour water, industrial discharge, or stagnant seawater.
Dissimilar metals can create galvanic corrosion
Connecting C46400 directly to stainless steel, aluminium bronze, carbon steel, or other metals can create a galvanic couple.
The risk depends on:
- Relative surface areas
- Electrical contact
- Electrolyte conductivity
- Flow conditions
- Coatings
- Cathodic protection
- Position in the galvanic series
Insulating gaskets, sleeves, coatings, or compatible transition components may be needed.
Is C46400 Worth the Additional Cost?
C46400 may cost more to purchase and machine than standard brass, but the correct comparison should be based on total cost of ownership.
Its corrosion resistance can reduce:
- Premature replacement
- Unplanned shutdowns
- Leakage
- Emergency maintenance
- Labour and dry-docking costs
- Damage to surrounding equipment
The economic case is strongest when the component is:
- Difficult to access
- Expensive to replace
- Continuously exposed to seawater
- Safety-critical
- Required to remain in service for many years
For decorative, freshwater, or non-corrosive applications, a less specialised brass may be more economical.
How Should C46400 Be Specified on a Drawing?
A complete drawing note should identify:
- UNS C46400
- Applicable material specification
- Product form
- Temper
- Required dimensions and tolerances
- Mechanical-property requirements
- Chemical certification requirements
- Heat or lot traceability
- Inspection and testing requirements
- Surface finish and joining requirements
The specification should also identify restrictions on material substitution, manufacturing location, sub-suppliers, and process changes.
Align Manufacturing’s main brass manufacturing overview provides additional guidance on matching brass grades with machining, forming, forging, finishing, inspection, and production-documentation requirements.
Conclusion
At Align Manufacturing, we manufacture precision metal components for marine, industrial, oil and gas, railway, construction, and heavy-equipment applications through casting, forging, CNC machining, stamping, and metal fabrication. For marine brass parts, we focus on matching the alloy and product form to the actual corrosion environment, mechanical requirements, and production route. We also support material verification, process control, inspection, and traceable documentation so that C46400 components are manufactured to the required specification rather than selected by alloy name alone.
FAQ
What is C46400 naval brass?
C46400 is a wrought copper-zinc-tin alloy containing 59.0–62.0% copper and 0.50–1.00% tin, with zinc making up most of the balance.
Why is C46400 used in marine applications?
Its tin content improves resistance to dezincification and marine corrosion compared with standard high-zinc brasses.
Is C46400 completely resistant to seawater corrosion?
No. Its performance can still be affected by high flow velocity, polluted water, ammonia, mechanical stress, and galvanic contact with other metals.
What specification covers C46400 rod and bar?
ASTM B21/B21M is commonly used for naval brass rod, bar, and shapes.
Can C46400 be hot forged?
Yes. Material intended for hot forging should be purchased under the applicable product specification and supplied in a suitable condition.
Is C46400 lead-free?
Its specified lead content is 0.20% maximum, but the finished product must still meet the applicable weighted-average lead and certification requirements before being marketed for covered potable-water use.
Is C46400 easier to machine than C36000?
No. C36000 is designed for high machinability, while C46400 is selected primarily for improved marine corrosion resistance.
What should be checked on a C46400 mill certificate?
Confirm the heat number, alloy designation, chemical composition, applicable material standard, product form, temper, required mechanical properties, and complete traceability.
APQP Phases for Manufacturing Suppliers: From Quote to Production

When an OEM includes APQP requirements with a Request for Quote, the number of documents, deadlines, and approval stages can feel overwhelming. However, APQP is more than a documentation exercise. It creates a structured process for confirming requirements, controlling risks, validating production, and preventing problems before launch.
This guide explains the five APQP phases from a manufacturing supplier’s perspective, including the key activities, documents, and PPAP requirements involved.
What Is APQP and Why Do OEMs Require It?
Advanced Product Quality Planning (APQP) is a preventive framework used to plan and develop products and manufacturing processes from initial concept through production.
APQP originated in the automotive industry and is now widely used by OEMs and suppliers to coordinate product requirements, quality planning, risk management, process validation, and launch readiness.
AIAG released the third edition of its APQP manual in March 2024, alongside the first standalone Control Plan manual. The updates place greater emphasis on change management, sourcing, risk assessment, programme metrics, sub-tier suppliers, and safe-launch planning.
APQP is closely connected to the automotive Core Tools:
- Failure Mode and Effects Analysis (FMEA)
- Measurement Systems Analysis (MSA)
- Statistical Process Control (SPC)
- Control Plan
- Production Part Approval Process (PPAP)
OEMs use APQP to confirm that suppliers understand the technical requirements and can consistently manufacture conforming parts at the required production rate.
What Happens During APQP Phase 1?
Phase 1: Plan and Define the Programme

Phase 1 establishes the project scope, customer requirements, feasibility, responsibilities, and timing.
The customer typically provides an RFQ package containing drawings, CAD data, material requirements, specifications, forecast volumes, quality requirements, and programme milestones. The supplier then evaluates whether the part can be produced consistently and economically.
Key Phase 1 activities
The supplier should review:
- Product specifications and tolerances
- Material and performance requirements
- Expected production volumes
- Available manufacturing capacity
- Tooling and equipment needs
- Inspection and testing requirements
- Packaging and logistics requirements
- Customer-specific requirements
- Sub-tier supplier risks
A cross-functional feasibility review should involve engineering, quality, production, purchasing, logistics, and commercial teams.
Phase 1 checklist
- Feasibility commitment
- Preliminary bill of materials
- Initial quality and reliability goals
- Preliminary process assumptions
- Project timing plan
- Capacity assessment
- Initial risk review
- Customer communication plan
How long does Phase 1 take?
The timeline depends on product complexity, specification quality, tooling requirements, and the speed of customer feedback. A straightforward component may be reviewed within a few weeks, while a complex assembly or newly-toolled part may require a longer feasibility process.
The supplier should avoid committing to pricing or timing before technical uncertainties have been identified.
What Happens During APQP Phase 2?
Phase 2: Product Design and Development
Phase 2 focuses on converting customer needs into a design that can be validated and manufactured.
Where the customer owns the design, the supplier normally provides manufacturing feedback, process knowledge, material recommendations, and design-for-manufacture input. Where the supplier has design responsibility, it may also own the product-design validation activities.
Key Phase 2 activities
Typical activities include:
- Design reviews
- Design for Manufacturing analysis
- Material selection
- Tolerance review
- Prototype planning
- Design verification
- Design validation
- Special-characteristic identification
- Drawing and specification updates
Prototype parts may be used to assess fit, function, material performance, and early manufacturing risks.
Phase 2 checklist
- Design Failure Mode and Effects Analysis, where applicable
- Design review records
- Prototype Control Plan
- Prototype inspection results
- Material and performance test results
- Design verification records
- Design validation records
- Updated drawings and specifications
What is a DFMEA?
A Design Failure Mode and Effects Analysis, or DFMEA, identifies how a product design could fail, evaluates the risks and effects of those failures, and defines actions to reduce them before production.
The DFMEA should remain connected to design changes, test results, customer complaints, and lessons learned rather than being completed once and filed away.
Who owns the DFMEA?
The organisation with product-design responsibility normally owns the DFMEA. A build-to-print supplier may not own the customer’s design, but it should still provide manufacturing feedback and identify design features that could create production or quality risks.
The supplier remains responsible for analysing risks within its manufacturing process through the PFMEA.
What Happens During APQP Phase 3?
Phase 3: Process Design and Development
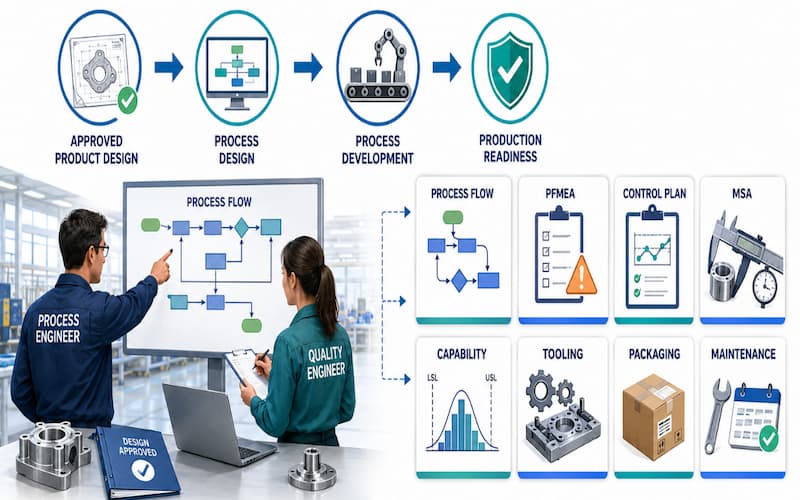
Phase 3 defines how the product will be manufactured, inspected, controlled, handled, and delivered.
This is where the supplier converts the approved design into a repeatable production system.
Key Phase 3 activities
The team develops the:
- Process Flow Diagram
- Process FMEA
- Control Plan
- Work instructions
- Inspection methods
- Measurement Systems Analysis plan
- Process capability study plan
- Tooling and fixture specifications
- Packaging standards
- Preventive maintenance requirements
Tooling, equipment, gauges, and sub-supplier activities must be planned early enough to support the validation schedule.
Phase 3 checklist
- Process Flow Diagram
- PFMEA
- Pre-launch Control Plan
- MSA plan
- Process capability plan
- Tooling and gauge approvals
- Process parameter specifications
- Operator instructions
- Packaging specification
- Preventive maintenance plan
What is the difference between a PFMEA and a Control Plan?
The PFMEA identifies how the manufacturing process could fail, why the failure may occur, and what effect it could have.
The Control Plan defines how the identified risks will be managed during production. It specifies:
- Characteristics to be controlled
- Measurement or inspection method
- Sample size and frequency
- Control limits
- Responsible personnel
- Reaction plan when a problem occurs
The Process Flow Diagram, PFMEA, and Control Plan should remain aligned. A process step or critical control should not appear in one document while being absent from the others.
What Happens During APQP Phase 4?
Phase 4: Product and Process Validation
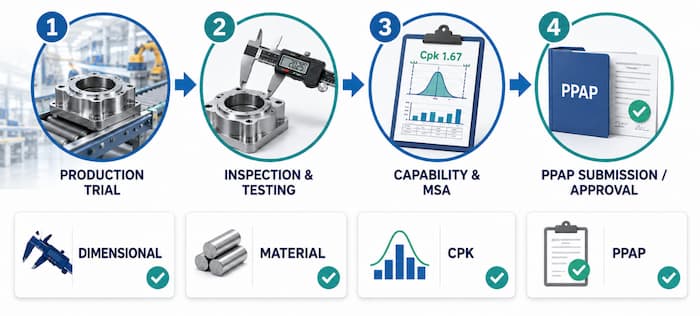
Phase 4 confirms that the production process can manufacture conforming parts under intended operating conditions.
The supplier runs production tooling, equipment, operators, materials, measurement systems, and process settings at the planned manufacturing location.
Key Phase 4 activities
Validation may include:
- Significant production run
- Dimensional inspection
- Material testing
- Performance testing
- Measurement Systems Analysis
- Process capability studies
- Packaging evaluation
- Production-rate verification
- Control Plan confirmation
- PPAP preparation
Capability targets and sample sizes should follow customer-specific requirements. Values such as Cpk 1.33 or 1.67 are commonly used in some programmes, but they are not universal requirements.
What are the PPAP submission levels?
PPAP provides evidence that the supplier understands the customer’s requirements and that the production process can consistently meet them.
| Level | Submission requirement |
| Level 1 | Part Submission Warrant only |
| Level 2 | PSW with product samples and limited supporting data |
| Level 3 | PSW with product samples and complete supporting data |
| Level 4 | PSW and other requirements defined by the customer |
| Level 5 | PSW, product samples, and complete supporting data reviewed at the supplier’s manufacturing location |
The customer determines the submission level. Level 3 is commonly requested, but suppliers should always follow the purchase order and customer-specific requirements.
Phase 4 checklist
- PPAP submission package
- Part Submission Warrant
- Dimensional results
- Material and performance test results
- Process capability results
- MSA results
- Appearance approval, where applicable
- Sample production parts
- Master sample
- Checking-aid records
- Production Control Plan
How does the PPAP submission process work?
The supplier completes the required production run, validates the parts and process, compiles the agreed PPAP evidence, and submits the package to the customer.
The customer generally responds with:
- Approved: The supplier may ship production quantities.
- Interim approval: Limited production or shipment is permitted for a defined period or quantity.
- Rejected: The submission does not meet requirements and must be corrected before approval.
PPAP should not be treated as a collection of unrelated documents. Its purpose is to demonstrate that the planning and controls developed through APQP work together.
What Happens During APQP Phase 5?
Phase 5: Feedback, Assessment, and Corrective Action

APQP continues after production launch. Phase 5 focuses on monitoring performance, reducing variation, resolving problems, and applying lessons learned.
Key Phase 5 activities
The supplier monitors:
- Product quality
- Process capability
- Scrap and rework
- Delivery performance
- Customer complaints
- Warranty information
- Production efficiency
- Corrective-action effectiveness
Statistical Process Control may be used for critical characteristics where appropriate. The production Control Plan, PFMEA, and work instructions should be updated when process knowledge or risks change.
Phase 5 checklist
- Production Control Plan
- SPC records
- Customer feedback
- Corrective-action records
- Process audit results
- Supplier performance data
- Lessons-learned records
- Continuous-improvement actions
When is PPAP resubmission required?
PPAP notification or resubmission may be required when a change could affect product or process performance, including:
- Material changes
- Product-design changes
- New or modified tooling
- Process changes
- Production-site relocation
- Sub-supplier changes
- Production restarting after an extended shutdown
- Changes to inspection or test methods
The exact notification and resubmission requirements depend on the PPAP manual and the customer’s specific requirements. Annual resubmission is not a universal PPAP rule unless required by the customer.
How Long Does the APQP Process Take?
APQP timing varies significantly by product, industry, customer, tooling, validation requirements, and supply-chain complexity.
| Phase | Main focus | Typical documents |
| Phase 1 | Requirements and feasibility | Feasibility review, timing plan, initial risks |
| Phase 2 | Product design | DFMEA, design reviews, prototype records |
| Phase 3 | Process design | Process Flow, PFMEA, Control Plan, MSA plan |
| Phase 4 | Validation and PPAP | Capability results, test reports, PPAP package |
| Phase 5 | Production improvement | SPC, corrective actions, lessons learned |
The phases also overlap. Tooling planning may begin before product design is fully complete, while PFMEA and Control Plan development continue as new information becomes available.
A supplier should build its timeline around customer milestones and actual lead times rather than applying one standard duration to every programme.
What Are the Most Common Supplier APQP Mistakes?
Treating APQP as paperwork
Documents should show how the team has identified and controlled real risks. Completing templates without cross-functional review provides little protection during production.
Accepting incomplete RFQ information
Missing drawings, unclear tolerances, unknown volumes, or undefined inspection requirements can create cost and timing problems later. Assumptions should be documented before quotation.
Starting tooling too late
Tooling is often one of the longest-lead elements. Design, approval, manufacture, trials, and modification time must be included in the programme schedule.
Suppliers planning tooling for sand casting in Thailand should also consider pattern design, core boxes, gating, machining allowances, and foundry trials during early APQP reviews.
Failing to connect APQP documents
The Process Flow Diagram, PFMEA, Control Plan, work instructions, and inspection records must reflect the same manufacturing process and controls.
For components produced from different investment casting materials, material-specific risks should be reflected consistently in process planning, testing, and inspection documents.
Skipping measurement-system validation
A process cannot be properly evaluated when the measurement system is unreliable. MSA should be completed before capability results are used to support PPAP approval.
Using prototype parts for production approval
PPAP parts should come from the intended production process under the required production conditions. Hand-finished prototypes may support design review but do not prove production capability.
Allowing the Control Plan to become outdated
The Control Plan should reflect production experience, corrective actions, engineering changes, and revised risk controls.
For complex assemblies involving Metal Fabrication Thailand, the Control Plan may need to cover cutting, forming, welding, machining, finishing, assembly, and final dimensional inspection.
Conclusion
At Align Manufacturing, we manufacture precision metal components through sand casting, investment casting, forging, CNC machining, stamping, die casting, and metal fabrication. We use structured planning, manufacturing-risk assessment, process controls, inspection, and traceable quality documentation to help customers move from quotation and product development into reliable production. We view APQP as a practical way to align customer requirements with the correct materials, tooling, production methods, validation activities, and quality controls before full-volume manufacturing begins.
FAQ
What are the five phases of APQP?
The five phases cover planning, product design, process design, product and process validation, and ongoing feedback and corrective action.
Is APQP only used in automotive manufacturing?
No. APQP originated in automotive manufacturing but similar planning methods are also used in aerospace, industrial equipment, medical products, and other quality-sensitive industries.
Is APQP the same as PPAP?
No. APQP is the wider planning and development framework. PPAP is the production-approval submission used to demonstrate that the manufacturing process can consistently meet customer requirements.
What is the latest AIAG APQP edition?
AIAG published APQP Third Edition in March 2024. It was released with the first standalone edition of the Control Plan manual.
Who is responsible for APQP?
APQP requires a cross-functional team. Depending on the organisation, this may include programme management, engineering, quality, manufacturing, purchasing, logistics, sales, and sub-tier suppliers.
What is the difference between DFMEA and PFMEA?
DFMEA evaluates risks in the product design. PFMEA evaluates risks in the manufacturing process used to make the product.
Which PPAP submission level is most common?
Level 3 is frequently requested because it includes the PSW, product samples, and complete supporting data. However, the customer determines the required level.
Does PPAP need to be renewed every year?
Not automatically. Annual PPAP renewal applies only when required by the customer. Notification or resubmission may also be required after defined product, material, process, tooling, supplier, or location changes.
Understanding OEM Supplier Scorecards and Performance: 2026 Framework

Understanding OEM Supplier Scorecards and Performance: A 2026 Framework
OEM supplier scorecards help brands evaluate contract manufacturers consistently, identify performance issues early, and make better sourcing decisions. Rather than treating the scorecard as a quarterly administrative exercise, effective procurement teams use it as an operating framework for supplier reviews, corrective actions, development plans, and future order allocation.
This guide explains the six main supplier performance categories, how to select and weight KPIs, how to calculate a composite score, and how to turn scorecard data into measurable action.
What Is an OEM Supplier Scorecard?

An OEM supplier scorecard is a structured tool used by a brand or original equipment manufacturer to measure the performance of a contract manufacturer producing finished goods, components, or sub-assemblies.
A typical scorecard combines quantitative KPIs, such as defect rates and on-time delivery, with qualitative assessments covering responsiveness, collaboration, risk management, and improvement efforts.
It can help a company:
- Track supplier performance over time
- Compare suppliers using consistent criteria
- Identify recurring quality or delivery problems
- Create corrective action plans
- Support supplier consolidation or replacement decisions
- Strengthen supplier relationships through structured feedback
The scorecard should not simply record past performance. It should give both the buyer and supplier clear evidence of what is working, what must improve, and what actions should follow.
Why Do OEM Supplier Scorecards Matter in 2026?
Supplier scorecards have become increasingly important because manufacturers are managing more complex supply networks, stricter customer requirements, and greater exposure to operational disruption.
Supply chain risks require earlier visibility
Late deliveries, quality escapes, material shortages, and sub-supplier failures can quickly affect inventory availability and customer commitments. A regularly updated scorecard helps reveal negative trends before they become major operational problems.
Sustainability and compliance data are becoming more important
Companies may need greater visibility into environmental, social, regulatory, and value-chain risks. European sustainability reporting requirements, for example, can require certain companies to assess impacts and risks arising within their value chains. However, the requirements vary by company size, jurisdiction, reporting scope, and implementation date.
Supplier consolidation increases dependence on retained partners
When a brand reduces its supplier base, each remaining contract manufacturer becomes more strategically important. A scorecard provides evidence for deciding which suppliers should receive additional volume, development support, or closer monitoring.
Which KPI Categories Should an OEM Supplier Scorecard Include?
Most supplier scorecards evaluate performance across six broad categories:
- Quality
- Delivery
- Cost
- Responsiveness
- Risk and compliance
- Innovation and continuous improvement
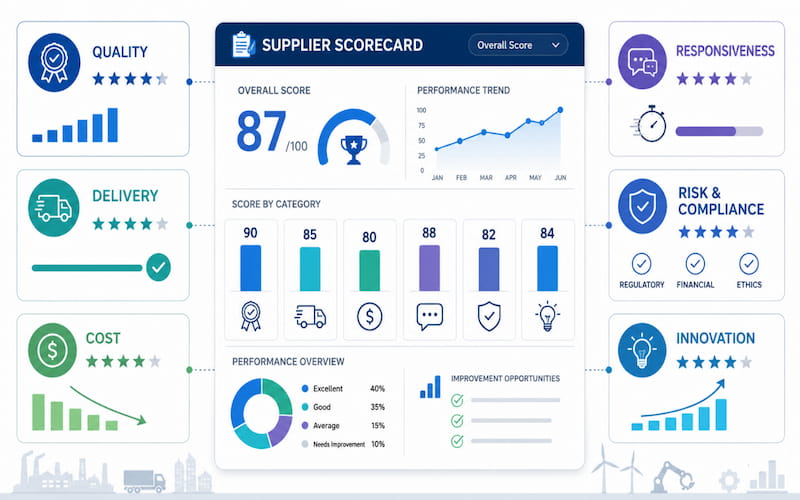
The exact metrics should reflect the product, industry, customer requirements, and risks involved. A focused scorecard is usually more useful than one containing dozens of loosely connected measurements.
Quality performance should measure product conformity
Quality is normally one of the highest-weighted categories because defects can lead to rework, returns, production stoppages, warranty claims, and reputational damage.
| KPI | Formula | Example Target |
| Defect Rate (PPM) | Defective units ÷ total units received × 1,000,000 | Set by product and industry risk |
| First-Pass Yield | Units passing without rework ÷ total units × 100 | Above 98% for many established production processes |
| Customer Return Rate | Returned units ÷ units sold × 100 | Trending downward |
| Incoming Rejection Rate | Rejected units ÷ units received × 100 | Within the agreed quality limit |
| Quality Audit Score | Completed audit score | Above the approved supplier threshold |
These figures should be treated as examples rather than universal benchmarks. Acceptable performance varies considerably between consumer products, industrial components, automotive parts, and regulated medical products.
Delivery performance should measure reliability
On-time, in-full delivery affects inventory levels, production planning, customer orders, and working capital.
| KPI | Formula | Example Target |
| On-Time Delivery | Orders delivered by the confirmed date ÷ total orders × 100 | Above 95% |
| Lead-Time Accuracy | Actual lead time compared with confirmed lead time | Within the agreed tolerance |
| Order Fill Rate | Quantity shipped ÷ quantity ordered × 100 | Above 98% |
| Delivery Completeness | Complete orders ÷ total orders × 100 | Above 97% |
| ASN Accuracy | Accurate and timely advance shipping notices ÷ total shipments × 100 | Above 95% |
The scorecard should clearly define whether delivery is measured against the original requested date, the supplier-confirmed date, or a revised date approved by both parties. Without this definition, delivery data can become misleading.
Cost performance should consider total cost
Unit price is important, but it should not be evaluated in isolation. A lower-priced supplier may create additional costs through delays, defects, rework, emergency freight, excessive administration, or inventory buffers.
| KPI | Formula | Example Target |
| Purchase Price Variance | Actual price compared with agreed price | Within contract tolerance |
| Total Cost of Ownership | Unit cost plus quality, logistics, delay, and administrative costs | Trending downward |
| Cost Improvement Contribution | Verified savings from supplier-led initiatives | Measured annually |
| Invoice Accuracy | Error-free invoices ÷ total invoices × 100 | Above 98% |
For many OEM relationships, total cost of ownership provides a more accurate view of supplier value than unit cost alone.
Responsiveness should measure communication quality
Responsiveness is partly qualitative, but it can still be measured consistently.
| KPI | Measurement | Example Target |
| RFQ Response Time | Average time to acknowledge or answer an RFQ | Within the agreed service level |
| Urgent Issue Response | Time to acknowledge critical problems | Within hours, not days |
| Problem Resolution Time | Average time to contain and resolve issues | Based on issue severity |
| Proactive Communication | Timely supplier-initiated updates | Consistent throughout the review period |
| Flexibility | Ability to manage changes or urgent requirements | Scored using defined criteria |
The goal is not to reward frequent communication without substance. The score should reflect whether information is timely, accurate, proactive, and useful for decision-making.
Risk and compliance should reflect the supplier’s exposure
Risk metrics should be tailored to the product, industry, country, and supply chain.
| KPI | Measurement | Example Target |
| Regulatory Compliance | Products meeting applicable requirements | 100% |
| Quality Management Certification | Valid certification and audit status | Appropriate to the industry |
| Business Continuity Planning | Documented and tested continuity procedures | Reviewed at least annually |
| Financial Risk | Agreed financial-risk indicator | Within the approved range |
| Cybersecurity Posture | Assessment against an accepted framework | Appropriate to the identified risk |
ISO 9001 is widely used as a quality management system standard, while sector-specific systems may apply to medical devices or automotive manufacturing. Certification should be verified for its scope, issuing body, validity, and relevance to the production site.
For cybersecurity risk, companies may use frameworks such as NIST CSF 2.0 to define and communicate supplier requirements.
Innovation should measure supplier-led improvement
Innovation metrics help distinguish a strategic manufacturing partner from a supplier that only executes purchase orders.
| KPI | Measurement | Example Target |
| Improvement Proposals | Practical value-engineering or process proposals | Reviewed annually |
| Implemented Savings | Verified savings from approved improvements | Trending upward |
| Joint Development Projects | Active co-development programmes | Based on relationship scope |
| Process Improvement | Documented improvements to quality, capacity, or efficiency | Demonstrated during reviews |
| Technology Adoption | Relevant use of automation or digital systems | Appropriate to the operation |
Only implemented or technically viable proposals should receive a strong score. Counting suggestions without considering their value can encourage activity rather than meaningful improvement.
How Should OEM Supplier Scorecard KPIs Be Weighed?
KPI weighting should reflect the consequences of supplier failure and the strategic priorities of the business.
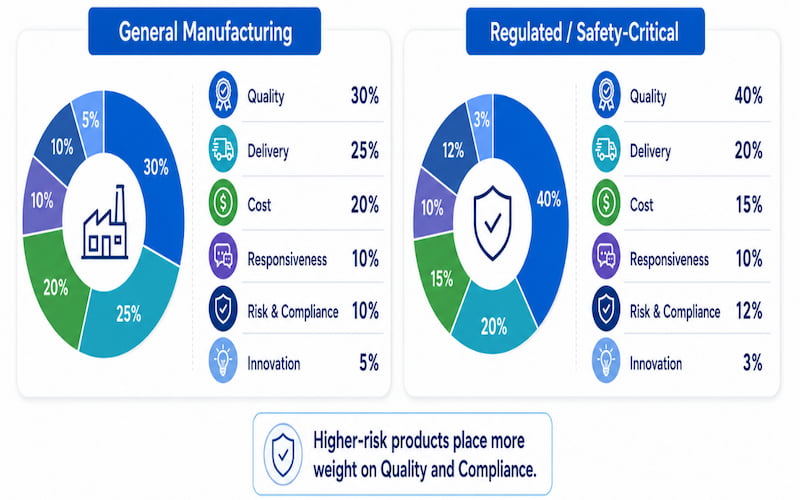
A general industrial or consumer product scorecard might use the following starting point:
| Category | Example Weight |
| Quality | 30% |
| Delivery | 25% |
| Cost | 20% |
| Responsiveness | 10% |
| Risk and Compliance | 10% |
| Innovation | 5% |
A regulated or safety-critical product may require a different balance:
| Category | Example Weight |
| Quality | 40% |
| Delivery | 20% |
| Cost | 15% |
| Responsiveness | 10% |
| Risk and Compliance | 12% |
| Innovation | 3% |
These are illustrative models, not fixed industry standards. Weighting should be agreed internally before suppliers are scored and should remain consistent throughout the review period.
Changing weights after reviewing the results can distort comparisons and undermine confidence in the process.
How Is a Composite Supplier Score Calculated?
Each KPI is assigned:
- A performance result
- A normalized score, commonly from 0 to 100
- A percentage weight
The weighted contribution is calculated by multiplying the score by its weight. The contributions are then added together.
For example:
| KPI | Score | Weight | Weighted Contribution |
| Defect Rate | 90 | 15% | 13.50 |
| First-Pass Yield | 92 | 15% | 13.80 |
| On-Time Delivery | 88 | 20% | 17.60 |
| Lead-Time Accuracy | 95 | 5% | 4.75 |
| Total Cost of Ownership | 90 | 20% | 18.00 |
| Responsiveness | 85 | 10% | 8.50 |
| Compliance and Risk | 85 | 10% | 8.50 |
| Innovation | 95 | 5% | 4.75 |
| Composite Score | 100% | 89.40 |
The company should define performance bands before applying the scorecard. An example classification is:
| Composite Score | Example Status |
| 90–100 | Strategic |
| 75–89 | Approved |
| 60–74 | Conditional |
| Below 60 | At risk |
A composite score should never hide a critical failure. A supplier with a strong overall result but a serious regulatory, safety, or quality issue may still require immediate escalation.
Which Contract Manufacturer KPIs Are Commonly Missed?
General supplier scorecards sometimes overlook the operational realities of contract manufacturing. The following metrics can provide a more complete picture.

Engineering change response should track implementation accuracy
Measure how quickly and accurately the supplier reviews, approves, documents, and introduces engineering changes.
The KPI should distinguish between:
- Time to acknowledge the change
- Time to complete the technical review
- Time to update tooling or processes
- Time to validate the revised part
- Accuracy of document and revision control
Tooling maintenance should measure production readiness
A supplier may meet quality targets while tooling is new but experience gradual performance deterioration as tooling wears.
The scorecard can track:
- Preventive maintenance completion
- Tooling condition
- Remaining useful life
- Calibration status
- Replacement planning
- Ownership and storage records
Capacity transparency should identify delivery risk
The supplier should provide enough visibility for the buyer to understand whether confirmed orders can be supported.
Useful measurements include:
- Available production hours
- Current utilization
- Bottleneck processes
- Surge capacity
- Planned shutdowns
- Dependency on shared equipment
Sub-supplier management should cover lower-tier risks
Contract manufacturers often rely on sub-suppliers for materials, treatments, coatings, machining, packaging, or testing.
The scorecard should evaluate whether the contract manufacturer:
- Approves and monitors sub-suppliers
- Maintains material traceability
- Controls outsourced processes
- Communicates significant changes
- Investigates lower-tier quality failures
- Maintains alternative sources where appropriate
Production audits should measure process control
Internal audit frequency alone is not enough. The scorecard should also evaluate whether findings are documented, corrective actions are completed, and recurring issues are prevented.
Certifications should be verified, not simply recorded
Quality system certifications should match the production site and the work being performed. Buyers should verify:
- Certificate validity
- Scope of certification
- Facility address
- Issuing certification body
- Open audit findings
- Corrective action status
Sustainability performance should use measurable evidence
Where sustainability is relevant to the sourcing decision, the scorecard may assess energy consumption, waste, water use, emissions data, material sourcing, or environmental management practices.
Targets should be proportionate to the supplier’s activities and based on data the supplier can reliably support.
How Can a Supplier Scorecard Be Put into Practice?
A scorecard only creates value when it is connected to accurate data, supplier reviews, and defined actions.
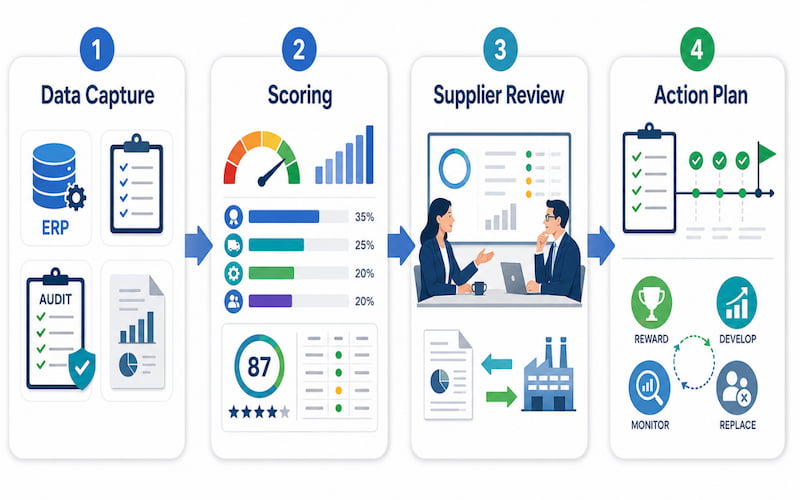
Step 1: Capture reliable supplier data
Possible data sources include:
- ERP purchase order and delivery records
- Quality inspection and non-conformance reports
- Customer complaint and return data
- Supplier self-assessments
- On-site audits
- Third-party compliance assessments
- Logistics and invoice records
Automated data should be used where possible, but it must still be checked for incorrect dates, duplicate records, incomplete transactions, and inconsistent definitions.
Step 2: Apply the agreed scoring model
Each KPI should have documented performance bands. For example, on-time delivery might receive:
| Result | Score |
| 98% or higher | 100 |
| 95%–97.9% | 90 |
| 90%–94.9% | 75 |
| 85%–89.9% | 60 |
| Below 85% | 40 |
The thresholds should reflect the company’s operational requirements rather than generic targets copied from another organization.
Step 3: Review results with the supplier
Scorecards should be shared with suppliers rather than used only as internal records.
A structured supplier review can cover:
- Current score and previous-period trend
- Strong-performing areas
- KPI gaps
- Root causes
- Corrective actions
- Responsible owners
- Completion dates
- Support required from the buyer
- Commercial consequences or opportunities
The supplier should be able to question inaccurate data and provide relevant operational context. However, explanations should not replace corrective action where performance repeatedly falls below the agreed target.
Step 4: Connect scores to sourcing decisions
A practical action model may include:
| Supplier Status | Possible Action |
| Strategic | Additional volume, longer agreements, early involvement, joint development |
| Approved | Maintain business, monitor trends, target selected improvements |
| Conditional | Formal improvement plan, closer reviews, backup sourcing |
| At Risk | Escalation, order reduction, replacement qualification, controlled transition |
The action should also reflect the severity of individual failures. A critical compliance issue may require escalation regardless of the composite score.
What Supplier Scorecard Mistakes Should Be Avoided?
Too many KPIs reduce focus
A scorecard containing dozens of measurements can become difficult to maintain and even harder to act on. Select KPIs that directly support quality, delivery, cost, risk, and strategic objectives.
Cost-only weighting creates the wrong incentives
Overweighting unit price can encourage suppliers to reduce inspection, maintenance, staffing, or capacity. Total cost, quality, and delivery should remain visible in the final evaluation.
Scores without action lose credibility
Suppliers are unlikely to prioritize a scorecard when strong performance receives no recognition and repeated underperformance produces no consequences.
Infrequent reviews allow problems to grow
Annual reviews may be sufficient for low-risk suppliers, but strategic or high-risk contract manufacturers normally require more frequent monitoring.
Excluding supplier input creates blind spots
Suppliers can help identify unrealistic targets, incorrect data, shared constraints, and process problems caused by the buyer. Their input should inform the review without weakening accountability.
Inconsistent scoring makes comparisons unreliable
Suppliers within the same category should be evaluated using the same definitions, formulas, periods, and evidence requirements.
What Are the Four Levels of Supplier Scorecard Maturity?
Companies generally progress through four levels as their supplier performance process becomes more structured.
Level 1: Ad hoc measurement
Performance information is spread across emails, spreadsheets, ERP reports, and individual knowledge. Reviews happen mainly when a problem occurs.
Level 2: Standardized scoring
A common scorecard is used across relevant suppliers. Reviews follow a defined schedule, and KPIs have documented formulas.
Level 3: Operationalized management
Data capture and calculations are partly automated. Suppliers receive regular feedback, and corrective actions are tracked to completion.
For casting suppliers, the evaluation may also include process-specific data such as mould consistency, pouring controls, heat treatment records, material traceability, machining allowances, and non-destructive testing results. These factors are particularly relevant when reviewing suppliers providing sand casting in Thailand or other regionally managed casting services.
Level 4: Strategic integration
Scorecard results influence sourcing strategy, supplier development, order allocation, risk management, consolidation, and joint improvement projects.
At this level, supplier reviews can also guide decisions about which manufacturing process is most suitable for a component. For example, understanding available investment casting materials helps buyers evaluate whether a supplier can meet the required strength, corrosion resistance, temperature performance, and dimensional accuracy.
How Should Metal Manufacturers Prepare for Scorecard Reviews?
Metal manufacturers should understand how their customers define success and ensure that performance evidence is accurate, traceable, and easy to review.
Preparation should include:
- Agreeing on KPI definitions before production begins
- Maintaining inspection and delivery records
- Monitoring trends rather than waiting for quarterly reviews
- Documenting corrective actions and their effectiveness
- Providing early notice of capacity or material risks
- Verifying sub-supplier controls
- Preparing evidence for quality and compliance claims
- Proposing realistic process or cost improvements
For suppliers providing metal fabrication in Thailand, scorecards may cover weld quality, dimensional accuracy, fabrication tolerances, material certificates, surface finishing, assembly quality, and production lead times.
Material and process controls should also match the component’s intended application. Projects involving sand casting stainless steel may require additional attention to alloy verification, casting integrity, heat treatment, corrosion performance, machining, and inspection documentation.
The strongest scorecard reviews examine more than the final shipment. They assess whether the supplier has stable processes, effective quality controls, appropriate equipment, qualified personnel, and the ability to prevent recurring problems.
Conclusion
At Align Manufacturing, we produce precision metal parts and components through sand casting, investment casting, CNC machining, forging, stamping, die casting, and metal fabrication for industries including oil and gas, railway, construction, truck and trailer, and industrial manufacturing. We believe an effective OEM supplier scorecard should evaluate the factors that directly affect metal component performance, including material quality, dimensional accuracy, defect rates, process control, delivery reliability, compliance, communication, and continuous improvement. By combining reliable production data with transparent supplier reviews and clearly defined actions, manufacturers can reduce sourcing risks and build more dependable long-term relationships.
FAQ
What is an OEM supplier scorecard?
An OEM supplier scorecard is a structured tool used to measure a contract manufacturer’s performance across agreed KPIs, such as quality, delivery, cost, responsiveness, compliance, risk, and continuous improvement.
How many KPIs should a supplier scorecard include?
There is no universal number, but a focused scorecard is generally more effective than one containing too many measurements. Select enough KPIs to cover the main operational and strategic risks without making the process difficult to maintain.
What is a good supplier scorecard result?
A good result is one that meets the company’s predefined performance threshold without hiding critical quality, safety, or compliance failures. Many organizations use categories such as strategic, approved, conditional, and at risk, but the numerical boundaries should be defined internally.
How often should supplier scorecards be reviewed?
Review frequency should depend on supplier importance and risk. Strategic or underperforming suppliers may require monthly or quarterly reviews, while stable, lower-risk suppliers may be reviewed less frequently.
What is the most important supplier scorecard KPI?
Quality and delivery are usually among the most important categories, but the weighting should reflect the product and its risks. Safety-critical and regulated products may require greater weighting for quality and compliance.
What is the difference between a supplier scorecard and a supplier audit?
A supplier audit assesses capabilities, processes, controls, or compliance at a particular point in time. A supplier scorecard tracks actual performance over a defined period. Audit findings can contribute to the scorecard, but the two tools serve different purposes.
How do supplier scorecards support sustainability reporting?
Supplier scorecards can collect relevant information about environmental performance, compliance, sourcing practices, and value-chain risks. However, the required data depends on the company’s jurisdiction, reporting obligations, materiality assessment, and applicable standards.
Should small companies use supplier scorecards?
Yes. A small company can use a simplified scorecard containing a few essential KPIs. The process can begin in a spreadsheet as long as the definitions are consistent, the data is reliable, and the results lead to action.
What software can be used for supplier scorecards?
Supplier scorecards can be managed through ERP systems, supplier management platforms, quality management systems, business intelligence tools, or spreadsheets. The process, data quality, and follow-up actions are more important than the platform itself.